
Data · Small business lending
Business Funding Statistics 2026: Lending, Approval and Demand Data
Every number on this page comes from a primary source published in 2025 or 2026, is dated, and links to where we found it: the Federal Reserve’s 2026 Small Business Credit Survey, the SBA Office of Advocacy, NFIB, NerdWallet, Intuit QuickBooks, Netstock and the Federal Reserve’s H.15 rate release. Use it to size a market, write a plan, brief a lender or check a claim. Quote it with a link.

What Are the Key Business Funding Statistics for 2026?
There are 36.2 million small businesses in the United States, 99.9% of all firms, employing 45.9% of the private workforce (SBA Office of Advocacy, 2025). In the past year 60% of small employers sought financing and 38% applied for a loan, line of credit or merchant cash advance; 81% of applicants were approved for at least part of the request and 42% received all of it (Federal Reserve, 2026). Equipment loans were approved in full most often (71%), followed by merchant cash advances (48%), lines of credit (45%), SBA loans (37%) and term loans (35%). Online lenders took 29% of applications, up from 17% in 2020, and 60% of their borrowers said the cost ran higher than expected. The prime rate is 7.00% as of October 2026, small businesses paid an average 8.2% on short-term loans in September, 77% of firms face rising costs and 47% cite tariffs.
The Whole Picture in One Table
| Statistic | Figure | Source and date |
|---|---|---|
| Small businesses in the U.S. | 36.2 million (99.9% of firms) | SBA Office of Advocacy, 2025 |
| Share of private workforce at small businesses | 45.9% (59 million employees) | SBA Office of Advocacy, 2025 |
| Small employers that sought financing | 60% | Federal Reserve SBCS, 2026 report |
| Applied for a loan, line or MCA | 38% | Federal Reserve SBCS, 2026 |
| Approved for at least some financing | 81% | Federal Reserve SBCS, 2026 |
| Approved for the full amount | 42% | Federal Reserve SBCS, 2026 |
| Applicants using an online lender | 29% (17% in 2020) | Federal Reserve SBCS, 2026 |
| Online borrowers reporting higher-than-expected cost | 60% | Federal Reserve SBCS, 2026 |
| Firms reporting rising costs | 77%; 47% tariff-related | Federal Reserve SBCS, 2026 |
| Prime rate | 7.00% (since Sept 17, 2026) | Federal Reserve H.15, Oct 20, 2026 |
| Average rate on short-term small business loans | 8.2% | NFIB, September 2026 |
| Owners naming inflation their top problem | 20% | NFIB, September 2026 |
| Approved borrowers with 700+ personal credit | 55% | NerdWallet, Jan 2026 |
| Share of request received by approved marketplace borrowers | 75% on average | NerdWallet, Jan 2026 |
| Expected 2026 holiday spend at small businesses | $118 billion (+8.3%) | Intuit QuickBooks, Aug 2026 |
| SMBs that passed tariff costs to customers | 82% | Netstock, 2026 |
Financing Demand in 2026
The Federal Reserve’s 2026 Report on Employer Firms (6,525 responses, fielded September to November 2025) found demand still driven by day-to-day operations: 56% of applicants wanted money for operating expenses, 46% to refinance or pay down debt, 42% for expansion, 28% for credit to have on hand and 26% for repairs or equipment. Among firms that did not apply, 63% said they did not need financing, 17% said credit was too expensive, 10% were debt-averse and 7% were discouraged, expecting to be turned down. Most requests were modest: 37% of applicants sought $50,000 or less and only 8% sought more than $1 million.
Why small businesses applied for financing in 2026 (share of applicants)
Source: Federal Reserve Banks, 2026 Report on Employer Firms.
Approval Rates by Product and Lender
| Product | Fully approved | Partially approved | Denied |
|---|---|---|---|
| Auto or equipment loan | 71% | 17% | 11% |
| Mortgage | 55% | 23% | 22% |
| Merchant cash advance | 48% | 40% | 12% |
| Business line of credit | 45% | 31% | 24% |
| Personal loan | 40% | 31% | 30% |
| SBA loan or line | 37% | 35% | 28% |
| Business term loan | 35% | 35% | 30% |
| Home equity line | 32% | 29% | 40% |
| Lender type | Share of applicants | Fully approved | Satisfied borrowers |
|---|---|---|---|
| Large bank | 41% | Not reported | 64% |
| Online lender | 29% | Not reported | 35% |
| Small bank | 28% | 57% | 65% |
| Finance company | 14% | 50% | 57% |
| Credit union | 7% | 44% | 76% |
Online lenders were chosen for speed and the chance of being funded; 60% of their borrowers reported costs higher than expected, against 37% at small banks and 32% at large banks. The full breakdown and what moves a file from partial to full approval is in business loan approval rates in 2026.
Who Gets Funded: Credit, Revenue and Time in Business
NerdWallet’s January 2026 study of loans approved through its marketplace between July 2024 and June 2025 shows the shape of an approvable file: 55% of borrowers had personal credit of 700 or higher; about 20% had 659 or below, and of those, 80% had at least $500,000 in annual revenue and 71% had been in business five or more years. The median business was seven years old, 65% borrowed for working capital, and borrowers received on average 75% of the amount requested. The Federal Reserve classifies 72% of employer firms as low credit risk, 22% medium and 6% high; 59% of firms with debt have a personal guarantee and 38% have pledged personal assets.
Credit risk profile of U.S. employer firms (Fed SBCS 2026)
Source: Federal Reserve Banks, 2026 Report on Employer Firms.
What Business Funding Costs in October 2026
| Product | Typical cost | Basis |
|---|---|---|
| Bank line of credit | 8% – 11% | Prime 7.00% + 1 to 4 |
| SBA 7(a) variable | 10.00% – 13.50% | Prime + 3 to 6.5 (SBA caps) |
| SBA 504 (fixed) | 6.3% – 7.0% | October 2026 debenture pricing |
| Bank term loan | 7% – 11% | Fixed |
| Online term loan | 10% – 36% APR | Fixed; 22% – 50% for weaker files |
| Equipment financing | 9.9% – 24% | Fixed |
| Online line of credit | 8% – 36% APR equivalent | 1.5% – 3% per draw |
| Invoice factoring | 1% – 4% per 30 days | Fee on invoice |
| Revenue-based / MCA | Factor 1.11 – 1.50 | Fixed payback |
| NFIB average short-term loan rate | 8.2% | September 2026 survey |
The prime rate rose to 7.00% on September 17, 2026, after the Federal Reserve raised the federal funds target to 3.75% – 4.00%, its first hike since 2023; the next decision is October 28. See prime rate is 7%: what it means for business loan rates and factor rate vs APR.
Rising Costs, Tariffs and the 2026 Squeeze
Revenue and employment expectations fell to their lowest since 2020 in the Fed’s survey (indexes of 33 and 39 for revenue, 23 and 26 for employment, 2024 vs 2025), while NFIB’s September 2026 Optimism Index slipped to 97.9, its Uncertainty Index rose to 90 against a 68 average, and 20% of owners named inflation their top problem. The financing playbook for a cost squeeze is in tariffs and small business working capital; the holiday-season version is in holiday inventory financing in 2026.
AI Adoption Among Small Businesses
The 2026 Fed survey added AI for the first time: 46% of small employers use AI, 15% plan to within 12 months, 33% have no plans and 6% are unsure. Among users, 83% use it for writing or marketing, 61% for individual productivity and 51% for planning or analysis, and 71% report increased productivity.
Small business AI use, 2026 (Fed SBCS)
Source: Federal Reserve Banks, 2026 Report on Employer Firms, N = 5,248.
Florida Small Business Statistics
Accommodation and food services (563,000 jobs), health care (529,000), construction (432,000), professional services (382,000) and retail (343,000) are Florida’s largest small business employers. Florida’s Commercial Financing Disclosure Law has required cost disclosures on commercial financing of $500,000 or less since January 1, 2024. See business funding in Florida.
How to Cite These Statistics
Each figure above names its source and date. For publication, cite the primary source and link to it; you are welcome to cite this page as a secondary source (“Business Funding Statistics 2026,” RAN Funding, ranfunding.com). We update this page when a source publishes new data, most recently on 21 October 2026 with the Federal Reserve’s 2026 Report on Employer Firms, NFIB’s September 2026 survey and the October 2026 H.15 release.
Embed These Charts
These charts are published for reuse by journalists, researchers, accountants and business publications. Each one cites its public data source and may be embedded or reproduced with attribution to RAN Funding and a link to the source page; a high-resolution PNG is at the image link. Figures are refreshed on the schedule in how we compare and rank lenders.
Approval Rates by Product
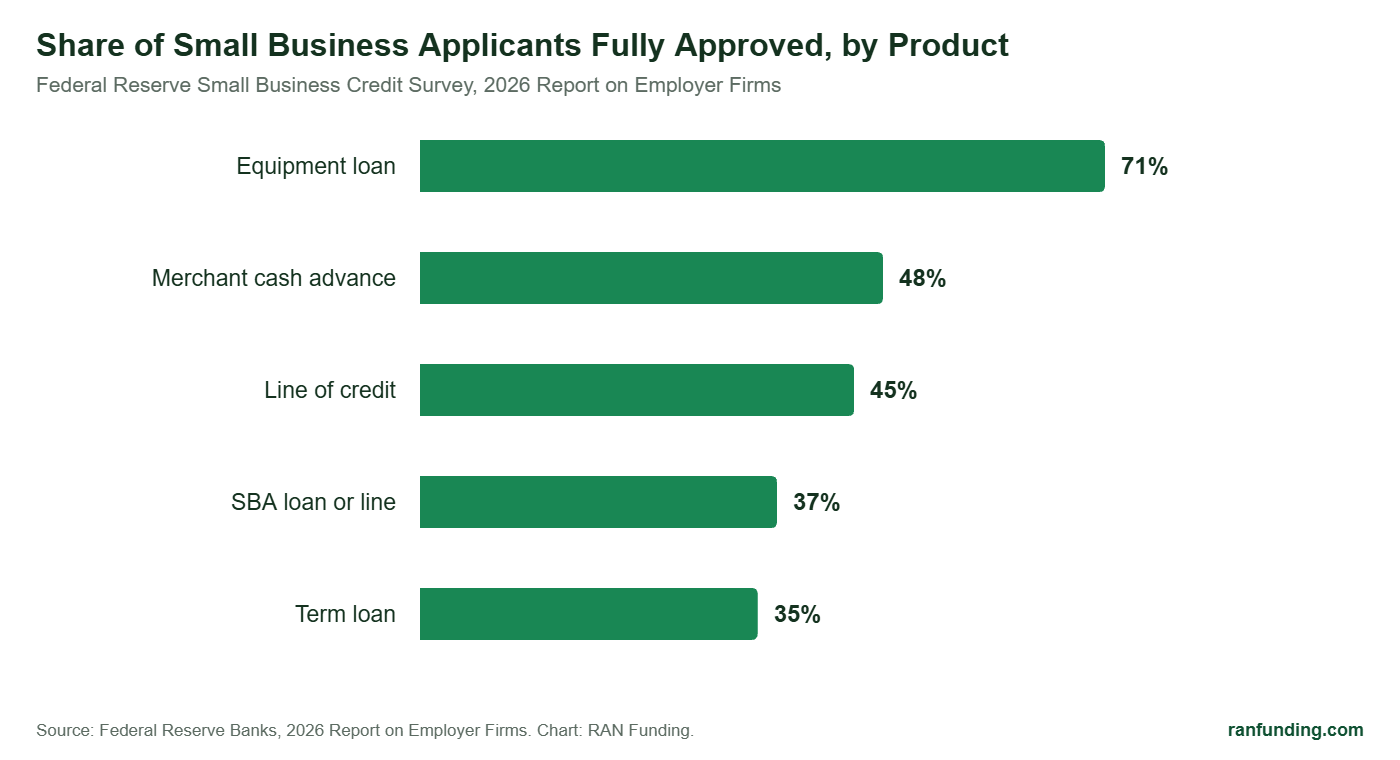
Free to reuse in articles, presentations and reports with a link back to the source page. Copy the code:
Who Paid More Than Expected
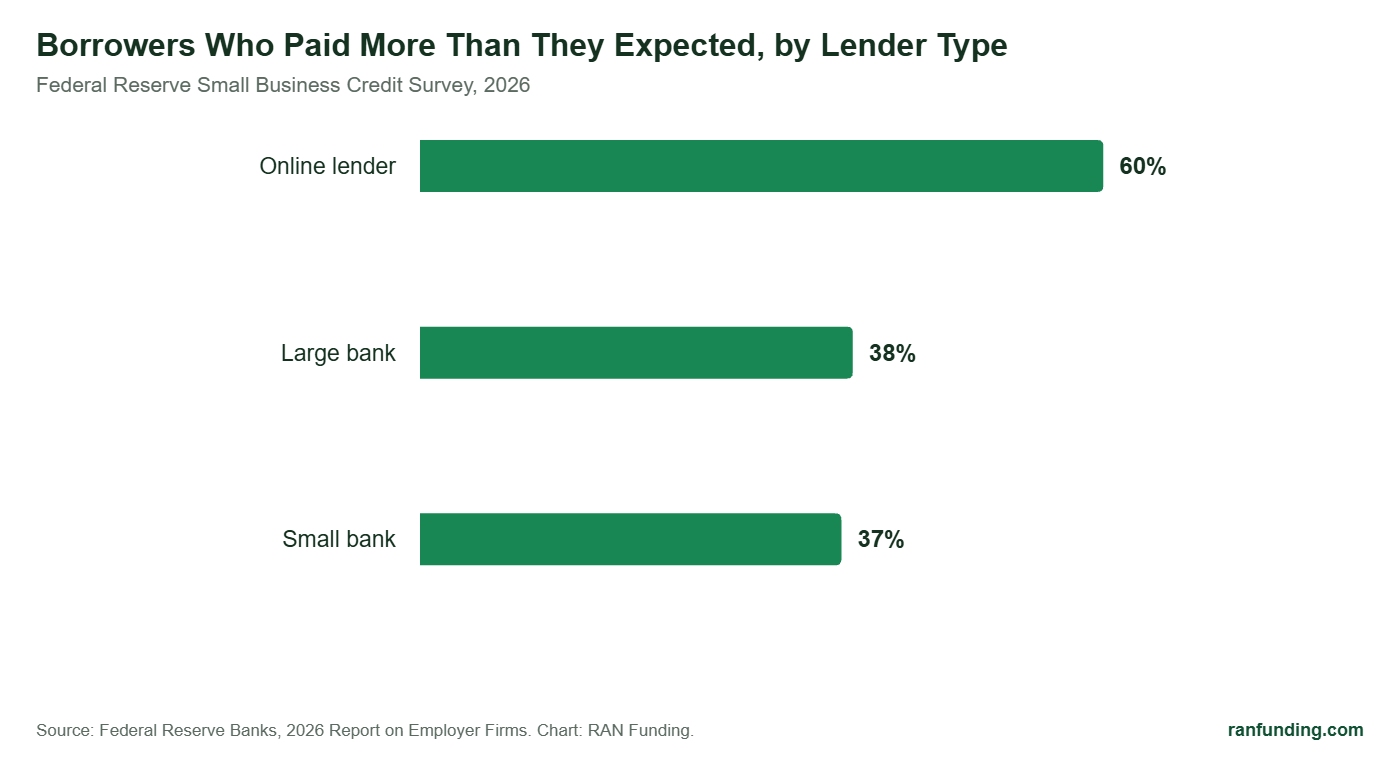
Free to reuse in articles, presentations and reports with a link back to the source page. Copy the code:
Common Questions
What percentage of small business loans are approved in 2026?
81% of applicants for a loan, line of credit or merchant cash advance were approved for at least part of the request and 42% received everything, according to the Federal Reserve’s 2026 Report on Employer Firms. Full-approval rates ranged from 71% for equipment loans to 35% for term loans.
How many small businesses are there in the United States?
36.2 million, representing 99.9% of all U.S. firms and employing 59 million people, 45.9% of the private workforce, according to the SBA Office of Advocacy’s 2025 profile.
What is the average small business loan interest rate in 2026?
NFIB reported an average rate of 8.2% on short-maturity small business loans in September 2026. By product, bank lines run 8% to 11% (Prime 7.00% plus a margin), SBA 7(a) loans 10.00% to 13.50%, online term loans 10% to 36% APR and revenue-based products factor rates of 1.11 to 1.50.
What share of small businesses use online lenders?
29% of applicants went to an online lender in the Federal Reserve’s 2026 survey, up from 17% in 2020. Online lenders were chosen for speed and the chance of being funded, but 60% of their borrowers said the cost was higher than expected.
Where do these business funding statistics come from?
From primary sources published in 2025 and 2026: the Federal Reserve Banks’ Small Business Credit Survey, the SBA Office of Advocacy, NFIB’s Small Business Economic Trends, NerdWallet’s 2026 business loan study, Intuit QuickBooks, Netstock and the Federal Reserve’s H.15 release. Each is linked in the Sources section.
Is RAN Funding a lender?
No. RAN Funding is a business financing broker. We present your application to our lender network and show you the offers you qualify for; the funding partner sets the approval, amount, rate, fees and terms.
Sources
- 2026 Report on Employer Firms: Findings from the 2025 Small Business Credit Survey — Federal Reserve Banks
- Frequently Asked Questions About Small Business, 2025 — U.S. Small Business Administration, Office of Advocacy
- Florida Small Business Profile, 2025 — U.S. Small Business Administration, Office of Advocacy
- NFIB Small Business Economic Trends, September 2026 — NFIB
- 2026 NerdWallet Business Loan Study — NerdWallet
- H.15 Selected Interest Rates — Board of Governors of the Federal Reserve System
- Small businesses are set to capture a record $118 billion this holiday season (Intuit QuickBooks survey) — Stacker / KEYT
- 2026 Tariff Impact Report — Netstock
- Current SBA loan interest rates, October 2026 — Lendio
See What You Qualify For
One application, about five minutes, soft pull only. A funding specialist tells you up front which products fit your file, what they cost and how fast each one funds.